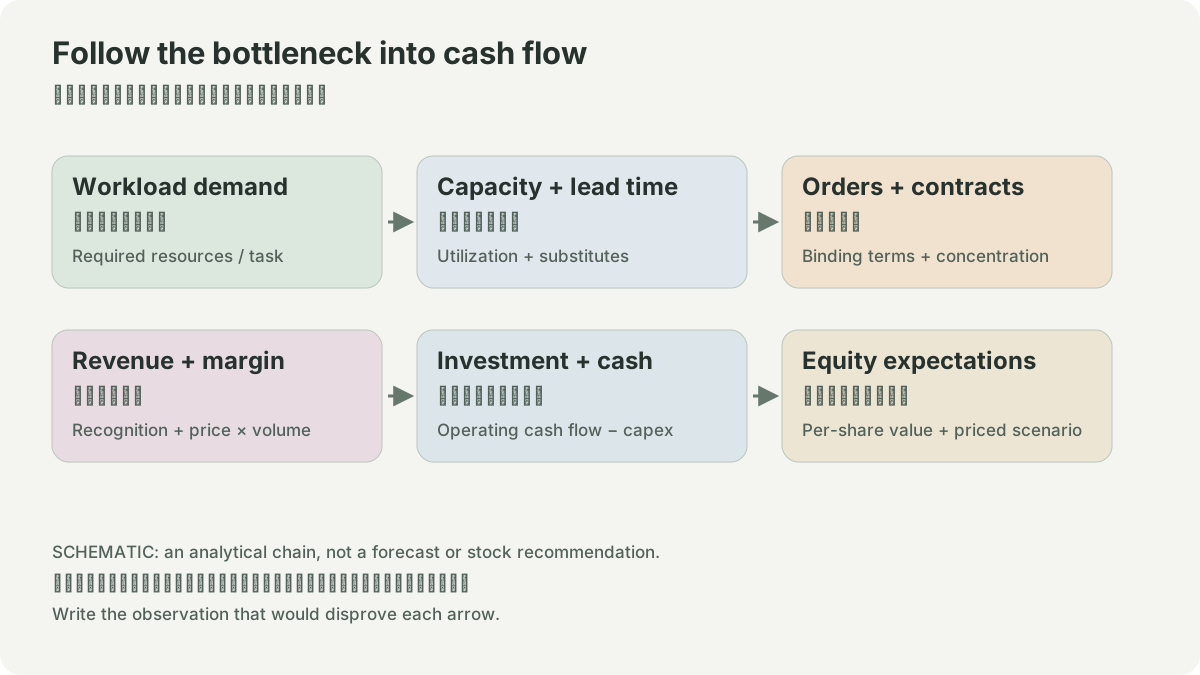
Four lines that should never be substituted
Memory manufacturing is capital intensive, so a strong earnings headline can tempt a reader to call every cash outflow “capex” or every profit dollar “cash generation.” Keep four distinct lines: GAAP revenue and gross profit are income-statement measures; operating cash flow includes noncash charges and working-capital changes; purchases of property, plant and equipment are capital expenditure; free cash flow is a defined calculation that must disclose its formula. A company’s non-GAAP metric is not automatically comparable with another company’s similarly named metric.
- 1revenue - cost = gross profit
- 2expenses/tax = GAAP income
- 1GAAP income + noncash items ± working capital = operating cash flow
- 1operating cash flow - PP&E purchases = a stated free-cash-flow convention
Micron’s FY2026 Q3 results page and FY2026 Q2 prepared remarks are primary starting points, but a number should be copied only from its dated release, filing, or reconciliation table. This chapter deliberately does not invent a revenue, capex, or cash-flow value where that exact table has not been retained here. The discipline matters more than filling a spreadsheet cell.
Why capex does not equal next-quarter supply
A capital-expenditure outlay can fund buildings, cleanroom preparation, tools, technology transitions, packaging, or other assets. Cash paid today may not create qualified sellable bits for many quarters. Wafer starts need process yield; HBM also needs good DRAM dies, stacking, logic/base-die work, packaging, testing, and customer qualification. Depreciation timing, prepayments, supplier lead times and construction-in-progress can separate a cash-flow line from available capacity.
Consider a clearly fictional calculation. A plant program spends $1.0 billion this year. If 60% is construction and 40% tools, and only half of the tools are installed next year, it would be false to call all $1.0 billion immediate capacity. Even installed tool capacity must be multiplied by utilization, process yield, product mix, packaging availability and qualification. The example is not a Micron forecast; it is a checklist for rejecting one-step capex-to-revenue claims.
Working capital supplies another trap. Revenue can rise while receivables absorb cash; inventory can consume cash before sales; payables can temporarily support cash. A falling inventory balance can release cash without proving a demand increase. Read the cash-flow reconciliation alongside the balance sheet and income statement, for the same fiscal period and GAAP basis.
Exercise: write a cash-to-capacity map
For a selected Micron filing, make columns for period end, GAAP revenue, GAAP gross margin, cash from operations, PP&E purchases, stated capex guidance, inventory, receivables, and any non-GAAP free-cash-flow definition. Then map each investment to a plausible stage—front-end wafer, technology transition, HBM packaging, or support infrastructure—only when disclosed. Add the time-to-qualification as unknown if not disclosed. A conclusion such as “capex rose, therefore next-quarter HBM revenue rises” fails unless every intervening condition has evidence.
ROOFLINE / HYPOTHETICAL INPUTS
Does memory feed the compute?
Upper bound = min(compute ceiling, bandwidth × arithmetic intensity). Decimal TB = 10¹² bytes. Cache effects, access patterns, communication and actual utilization are omitted; this is not a device benchmark. More capacity does not necessarily increase bandwidth.
SOURCES
01YOUR NOTES