Start with the work that is waiting
Production starts, good units, accepted shipments and collected cash are four separate quantities. This chapter connects a hypothetical yield calculation to the actual AAOI inventory, receivables and operating-cash observations below. Higher factory capacity cannot by itself establish higher cash generation.
- 1HBM and accelerator
- 2NIC electrical lanes
- 3switch fabric
- 4copper or optical engine
- 1optical engine
- 2receiver and DSP
- 3remote accelerator
- 4next collective operation
- 1qualified starts + yield + test + customer acceptance
- 2recognized revenue
Follow the conversion chain
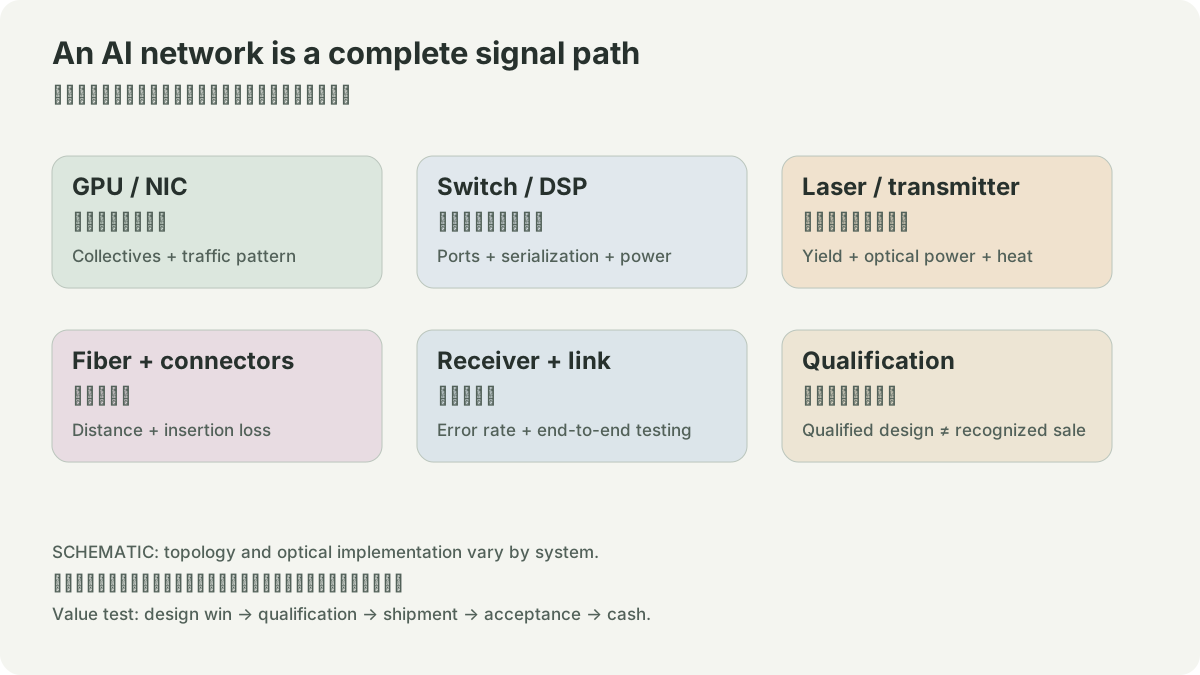
An accelerator or switch serializes data onto electrical lanes. Depending on the design, a DSP equalizes the signal or recovers timing; drivers and lasers convert it into light; fiber carries the light; photodiodes, receivers, and DSPs reconstruct electrical data. The useful question is not whether optics are “hot,” but where conversion, reach, power, heat, test time, and serviceability land. technical reference and technical reference provide technical vocabulary for the first boundary, while APPLIED OPTOELECTRONICS, INC. 8-K filed 2025-08-26 is a time-stamped company record. They are not interchangeable evidence. An interface label compresses lane count, modulation, host interface, optical reach, thermal envelope, and operations policy.
For planning, aggregate rate can be written as lanes times lane rate. Goodput is smaller because utilization, encoding, retransmission, congestion, and application communication shape it. A teaching equation is goodput equals port rate times observed utilization times one minus protocol overhead. It is not a performance measurement. Write every unobserved term as an assumption. technical reference is useful for identifying what an interface name can mean; it cannot establish a supplier’s shipment volume or a customer deployment.
Why the next bottleneck moves
Shortening an electrical path by bringing optics nearer to silicon can improve one signal budget while making thermal design, repair, packaging yield, and replacement logistics more important. Replacing a short optical link with an active electrical cable can simplify one path while moving the reach and power boundary. Increasing production may move the constraint to lasers, assembly, burn-in, test, fiber, customer qualification, or working capital. “The next bottleneck” must therefore name a stage and a falsifiable observation. APPLIED OPTOELECTRONICS, INC. 8-K filed 2025-08-26 should be read for period-specific risks and accounting language before demand is converted into an assertion about cash.
Qualified capacity is not announced floor space. A useful operational decomposition is shippable units equal starts times yield times test-pass rate times acceptance rate. Each term has an owner and a failure mode. A purchase order, a forecast, shipment, customer acceptance, and recognized revenue are different events. Customer-concentration disclosures can show exposure without identifying a customer, a product, a contract term, or future volume. APPLIED OPTOELECTRONICS, INC. 10-Q filed 2025-08-07 and APPLIED OPTOELECTRONICS, INC. 8-K filed 2025-08-07 are separate primary records to compare, not proof that similar companies will have similar outcomes.
Read a financial record before a ratio
A 10-K or 10-Q is a dated accounting record. Before calculating anything, write fiscal period, currency, units, filing date, and whether a number is GAAP or non-GAAP. Revenue and gross margin can create questions about mix or utilization. Inventory and receivables can create questions about cash conversion. Operating cash flow can differ from earnings because working capital moves. No single line proves durability of demand. Keep a table with the exact filing URL beside every value; never merge a fiscal quarter with an access date.
A bull, base, and bear worksheet is useful only when it exposes conditions. A bull case might require qualification success, a better mix, stable yield, and bounded working capital. A base case can retain disclosed operating conditions. A bear case can include qualification delay, price pressure, inventory growth, or a competing interconnect. Put the disconfirming observation beside every case. This chapter intentionally does not produce a target price: discount rates, terminal assumptions, capital structure, and market prices would add assumptions not verified by these sources.
Reading lab
build a hypothetical yield waterfall with assumptions visible. Make four columns: released fact, vendor claim, independent measurement, and your calculation. For every sentence, record URL, publication date, access date, fiscal period, unit, and the narrow claim it supports. Do not copy a financial number until its table and period are visible. Do not compare a technical product until interface, reach, temperature, power, and test conditions are recorded. This is an offline exercise. It does not execute a trade, contact a supplier, or validate a deployment.
Evidence boundary from 2024 onward
The 2024-to-current story is not that every AI component is scarce. Accelerators, HBM packaging, NICs, switching silicon, copper, optical modules, lasers, fiber, and test equipment have distinct lead times and substitution paths. Pages without a published date are marked unknown and only prove access on 2026-10-04; they are not treated as a new release. No September 2026 financial result or stock quote is claimed without an article-specific dated primary source. Revisit this map when a filing changes segment, concentration, inventory, cash-flow, or revenue-recognition language, or when a dated technical release changes a qualified interface.
AAOI cash conversion example: a capacity build can consume cash
The year ended December 31, 2025 is a concrete reminder that capacity and cash are different state variables. AAOI's 2025 Form 10-K, filed February 26, 2026, reports $179.148 million of payments to acquire property, plant, and equipment and $174.428 million of net cash used in operating activities. It also reports year-end inventory of $183.105 million and accounts receivable of $244.404 million. These disclosed annual values do not say which SKU or customer created them. They do show why “more demand” cannot be equated with free cash flow without checking the conversion cycle.
For the June 30, 2026 quarter, the filed 10-Q reports inventory of $278.791 million, receivables of $314.009 million, and first-half operating cash flow of negative $73.781 million. A diagnostic worksheet should calculate changes only against the stated prior-period balances, then ask whether the change is explained by production starts, yield rework, customer acceptance, payment terms, or an accounting classification. The numerical facts come from the filing and SEC company facts; the causal explanation remains a question until management disclosure or independent evidence supports it.
NETWORK / HYPOTHETICAL INPUTS
Port labels and useful throughput differ.
An 800 Gb/s port multiplied by the selected useful fraction. This toy fraction combines idle time and overhead; it is not a measured link or a protocol model. Tail latency, topology, retries and collective algorithms need separate measurements. It cannot predict a supplier’s sales.
SOURCES
01YOUR NOTES