Begin at the port, not the ticker
“Optics” is too wide a category to compare two suppliers by name alone. A link between AI racks can contain a switch ASIC, electrical host lanes, a DSP or retimer, laser driver, laser, modulator, receiver, package, fiber, connector and test process. A company can participate in one of those layers while also selling to industrial, communications, consumer, display, semiconductor-equipment or other markets. The question is therefore: which technical boundary is supplied, to which customer class, under which qualification and manufacturing constraints?
Lumentum's cloud-networking page is useful as a product-oriented starting point, while Lumentum's SEC-filings index is where period-labelled financial and risk disclosures belong. Coherent's annual-reports index plays the corresponding filing role. An index establishes where the primary records are; a claim about a segment, margin, customer or shipment needs the specific report and period.
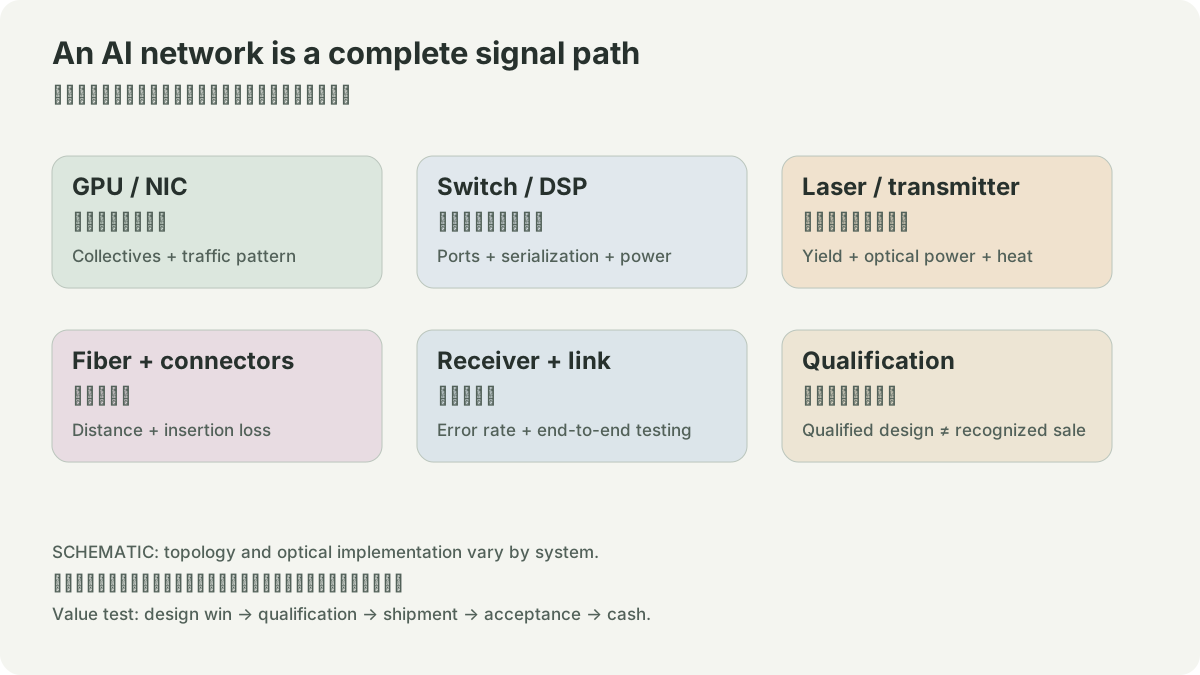
- 1Switch electrical lane
- 2driver and laser
- 3optical path
- 4receiver / DSP
- 5remote switch or NIC
- 1laser die and epitaxy
- 2package and coupling
- 3module assembly
- 4burn-in and final test
- 1issuer segment definition
- 2fiscal period
- 3reported result
- 4comparison worksheet
Compare four boundaries
First, compare the product boundary. A laser supplier, a component maker, a module assembler and a finished-transceiver vendor face different yield, inventory, warranty and pricing mechanics. Second, compare the end-market boundary. Datacom demand does not make industrial or consumer exposure disappear; a segment may combine several markets. Third, compare the manufacturing boundary: internally made die, outsourced assembly, contract manufacturing, test capacity, and qualified second sources create different failure modes. Fourth, compare the reporting boundary. Issuers choose reportable segments and fiscal calendars; an annual total cannot be cleanly compared with a different period or a non-GAAP measure without relabelling it.
A good worksheet has rows for product, customer interface, manufacturing step, reported segment, fiscal period, currency and unit. It also has a column labelled “not disclosed.” This is more valuable than filling an empty cell with an analyst's inference. For example, a public product page can show that a company addresses cloud networking; it cannot by itself prove a particular hyperscale customer, volume, design win, manufacturing yield or gross margin.
A hypothetical port-value map
Assume an imagined 800G link costs 100 units at the port level. The exercise allocates 25 to switching silicon and host-side electronics, 20 to DSP and electrical conditioning, 20 to optics and laser subassembly, 15 to package, fiber and connector, and 20 to assembly, test, warranty and logistics. Those figures are invented and do not describe either company. Their lesson is that “the optics share” changes when the technical boundary changes. A supplier of laser die, a supplier of a packaged optical engine, and an assembler of the finished module can all touch the same port while earning different economics and carrying different field-risk.
Changing from pluggable modules to a closer optical engine might reduce an electrical signal-loss problem. It can increase thermal coupling, assembly yield sensitivity and repair complexity. Adding another laser source can lower supply risk but needs qualification and may change performance bins. Those tradeoffs explain why a bill-of-materials estimate is not a revenue forecast.
Exercise
Choose one dated annual report from each issuer. Copy only its stated segment names, fiscal year-end, reported unit and risk language into a side-by-side table. Then map each named product to one place in the component diagram, leaving ambiguous items blank. Add one falsifiable observation for each claim: a specific product data sheet for the interface, a filing table for a financial result, and a qualification statement for manufacturing exposure. Do not compare price-to-sales, margins or market share until the periods, definitions and units match. This is a reading and systems-design exercise, not a recommendation about either issuer.
NETWORK / HYPOTHETICAL INPUTS
Port labels and useful throughput differ.
An 800 Gb/s port multiplied by the selected useful fraction. This toy fraction combines idle time and overhead; it is not a measured link or a protocol model. Tail latency, topology, retries and collective algorithms need separate measurements. It cannot predict a supplier’s sales.
SOURCES
01YOUR NOTES