One load, several systems
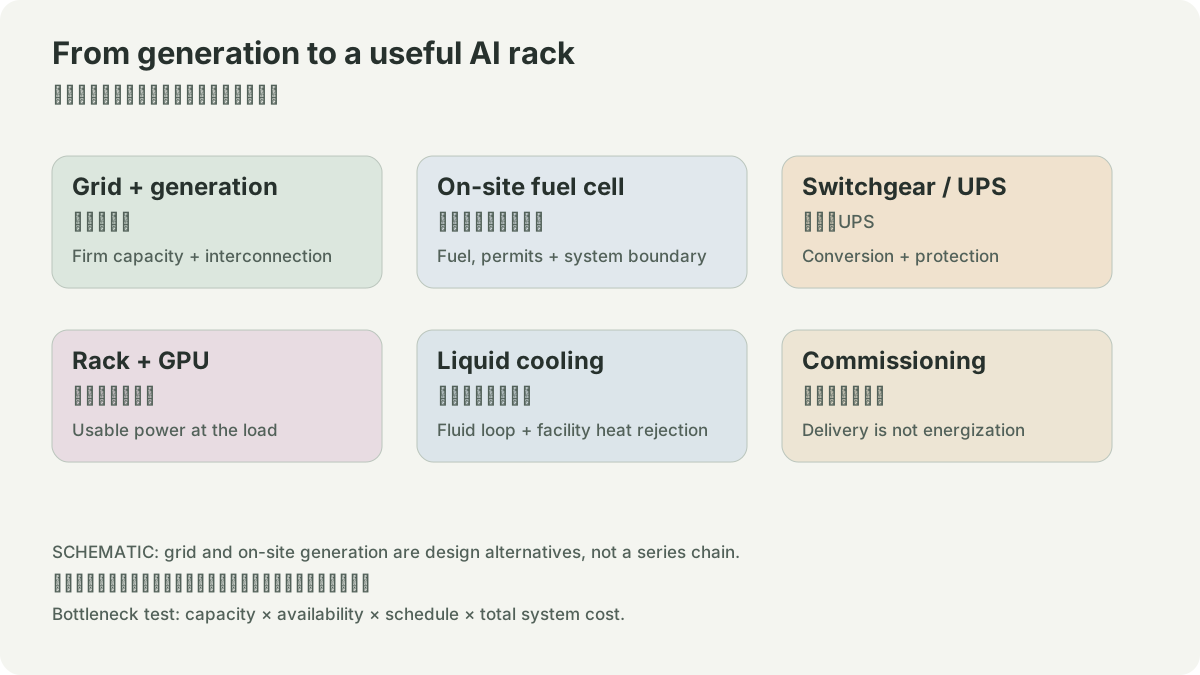
“AI data-center power” is not a single market. A GPU consumes low-voltage DC, while the campus must receive and protect medium- or high-voltage AC, reject heat, and satisfy a utility or an onsite-generation operator. Between them sit power shelves, busways, UPS equipment, transformers, switchgear, feeders, cooling equipment, controls, contracts, and permits. The owner, lead time, and failure mode change at every handoff.
The national context is real but is not a site model. DOE reported that U.S. data centers used about 176 TWh in 2023 and estimated 325–580 TWh by 2028 in its scenario analysis (DOE, 2024). That range describes possible aggregate demand. It does not establish available MW at a particular substation, nor does it select an onsite-power vendor.
Build a load ledger before a capacity claim
Start with the IT load, then expose assumptions. In a teaching example, a 100 MW IT load at PUE 1.20 implies 120 MW facility input: 20 MW is allocated to cooling, conversion losses, lighting, pumps, and other overhead. This arithmetic is deliberately incomplete. It excludes redundancy topology, simultaneous-maintenance rule, load ramps, harmonic limits, and curtailment. A 100 MW nameplate request can therefore be a poor proxy for the MW that must be firm at the point of interconnection.
Create separate rows for IT demand; conversion losses; cooling at the hottest design condition; reserve margin; startup and ramp behavior; expected operating hours; and load which can actually be shed. For each row, state whether it is metered, engineered, contractual, or only assumed. That distinction prevents a planning presentation from being mistaken for operating evidence.
Follow energy and authority upstream
The electrical chain is typically utility transmission or distribution service, substation and feeder, site transformer and switchgear, UPS or DC conversion, rack distribution, and server power supplies. The thermal chain is server heat, coolant or air loop, pumps and heat rejection, then a water, air, or refrigerant boundary. A failure in any one can constrain compute even if generation capacity exists elsewhere.
Large loads also affect the grid dynamically. NERC’s 2025 reliability overview describes an event in which roughly 1,500 MW of data-center load disconnected after a 2024 transmission fault; it uses the event to explain why planners need better models of collective load behavior (NERC, 2025). It is evidence of a reliability question, not evidence that all data centers behave the same way. Ask who has the data and authority to set ride-through, protection, and ramp limits.
Onsite generation can change the sequence but not erase the chain. It can reduce dependence on a delayed grid upgrade, while introducing fuel delivery, air permitting, equipment commissioning, maintenance, and backup-service questions. FERC’s large-load docket explicitly asks how studies, upgrades, reliability, and co-location should be handled for loads generally above 20 MW (FERC RM26-4). A campus may consequently need both an onsite operating plan and a grid-service plan.
What evidence changes the decision?
Use a four-column diligence sheet: physical asset, responsible party, governing document, and acceptance test. A transformer order is not an energized transformer. A utility study is not an executed service agreement. A supplier announcement is not delivered capacity. Revenue is not a measure of available electrical output. This is especially important when a supplier compares a design to a hypothetical gigawatt campus: the comparison is a provider estimate unless an independent study validates identical assumptions.
The useful investment or procurement question is not “who benefits from AI power demand?” It is “which constraint is binding here, what must happen to release it, and who bears delay cost?” A generator manufacturer may be exposed to manufacturing slots and fuel terms; a developer to interconnection and construction; an operator to availability and electricity price. The answer can differ by site.
Exercise
Draw two 100 MW IT-load cases. In Case A, grid service is the only supply. In Case B, onsite generation operates while grid work proceeds. For every box in the diagram, identify the required agreement, cash trigger, acceptance measurement, and stop condition. Keep unknown dates blank; replacing them with a vendor schedule creates false precision.
- 1GPU DC load
- 2rack conversion
- 3building distribution
- 4cooling and heat rejection
- 1building demand
- 2utility interconnection or onsite generation
- 3fuel and reliability obligations
- 1study or announcement
- 2executed agreement
- 3commissioning test
- 4operating and cash evidence
POWER / HYPOTHETICAL INPUTS
IT power is only part of facility energy.
Annual energy = IT MW × PUE × 80% load factor × 8,760 hours. PUE = facility energy / IT energy. This planning example ignores seasonal changes and availability; it does not establish grid connection, fuel consumption or generation efficiency.
SOURCES
01YOUR NOTES