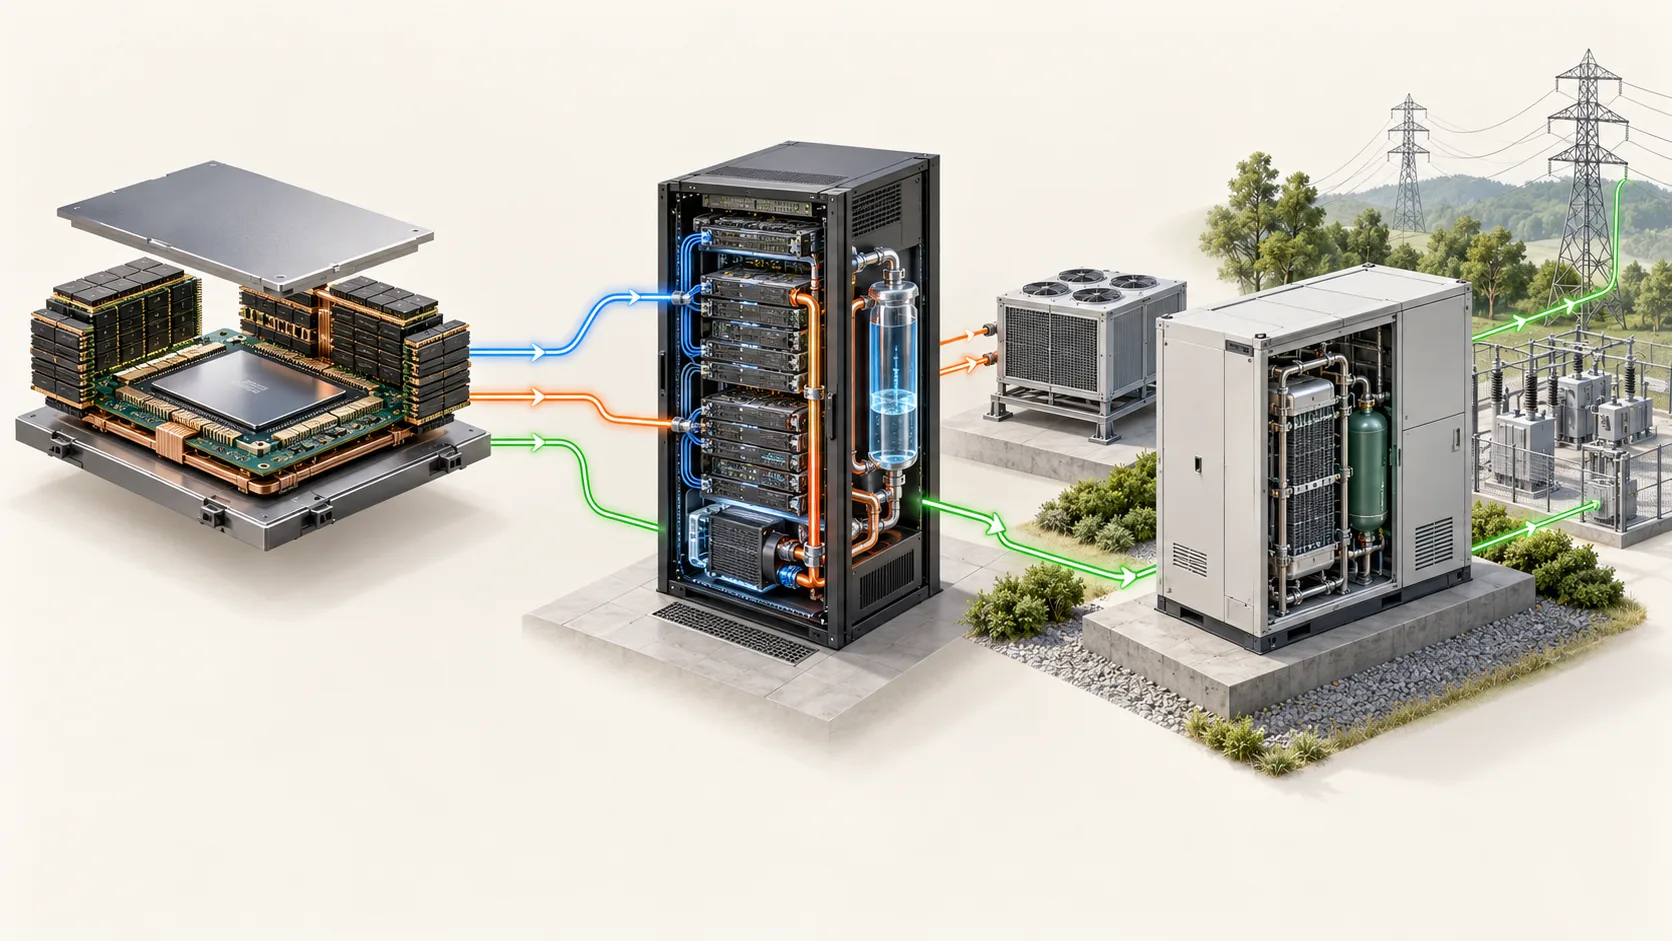
Original AI-generated conceptual illustration. It is not a product photograph, an engineering layout or a measurement. The detailed diagrams in each course describe the mechanisms separately.
A scarce component is only the first link
An accelerator that waits for memory needs bandwidth. A rack that cannot be energized needs available power. A distributed job that waits for a collective operation needs communication throughput and acceptable latency. Those observations explain customer demand; they do not yet explain the supplier's profit or the price of its shares. Investment research must follow four more conversions: a qualified product becomes a shipment, a shipment becomes recognized revenue, revenue produces cash after costs and reinvestment, and that cash is divided among the owners of the business.
- 1Workload constraint
- 2qualified solution
- 3shipments and price
- 4operating cash
- 1Operating cash
- 2reinvestment and financing
- 3diluted ownership
- 4market expectations
Sandisk sells flash-based products; HBM is stacked DRAM. A NAND producer can benefit from AI storage growth without manufacturing HBM. Bloom sells power systems and related installation, service and electricity activities; the value of an earlier energization date depends on fuel, permits, reliability and total costs. AAOI manufactures optical products; qualified production, yield and customer acceptance constrain the conversion from a faster network standard to revenue. These are three different businesses exposed to parts of the same capital-spending cycle.
Three concrete questions, three different accounting clues
Sandisk's FY2026 10-K disaggregates revenue into Datacenter, Edge and Consumer. Use that table to check whether a claim about AI demand describes the whole company or a growing subset. Do not turn the word “memory” into an HBM exposure score. With Bloom, separate product margin from installation and service economics: deploying a system and keeping it reliable can consume resources after the original sale. For AAOI, inspect receivables, inventory and investment alongside revenue. A fast ramp can require cash before customer collections arrive. The linked filings supply the company-specific accounting records; none measures the returns of a future investment.
Consider an original toy supplier, with sales of 1,000 monetary units, gross margin of 30%, operating costs of 180 and tax expense of 24. Operating profit is 120 and profit after tax is 96. If revenue grows 20% while gross margin falls to 24%, gross profit becomes 288, below the original 300. Keeping operating costs at 180 leaves operating profit of 108. Demand growth alone did not improve operating profit. A price increase, lower yield or adverse product mix could explain such a result, but the arithmetic cannot identify which cause occurred.
Find who captures the improvement
Compare a supplier's ability to negotiate price with the customer's ability to redesign around it. Ask whether qualification is long enough to protect a relationship, whether several vendors can supply the same interface and whether a component can be replaced by a different architecture. A laser supplier, a transceiver assembler and a switch vendor may see the same port transition but capture different margins. Grid delays may increase the value of local generation, while permitting or gas capacity can constrain its own delivery. Increasing HBM production can shift scarcity to packaging or test rather than eliminate it.
An improvement becomes valuable to shareholders only after the cost of maintaining it. Count additional equipment, working capital, engineering support and financing. If a toy business raises profit from 100 to 120 but diluted shares rise from 100 to 130, profit per share falls from 1.00 to approximately 0.92. Issuing shares may finance worthwhile growth, but business growth and growth per existing share are separate outcomes. Use the diluted denominator and inspect convertible instruments and customer warrants.
Build a research card that can be disproved
Write a one-page card for SNDK, BE and AAOI. Give each a physical constraint, a paying customer need, a measurable revenue driver, a cash driver and a valuation condition. For SNDK the card might monitor NAND pricing, shipped capacity, end-market mix and venture funding. For BE it might monitor commissioned capacity, acceptance, product/service economics and fuel constraints. For AAOI it might monitor customer qualification, optical product mix, cash collection and production yield. These are research hypotheses, not assertions that the quantities have improved.
For every favorable hypothesis write the observation that would weaken it. A longer backlog can coexist with slower acceptance. More capacity can coexist with lower utilization. A rising stock can coexist with worse cash conversion. Start with the relevant dated filing, keep quarterly and annual periods distinct and compare the same definition across releases. The outcome is a chain you can update when evidence changes, rather than a permanent list of supposed winners.
VALUATION / HYPOTHETICAL INPUTS
How much does one assumption change value?
Toy model: current annual cash flow 500m, debt 1,000m, cash 200m and 100m diluted shares. EV = cash flow × (1 + g) / (r − g); equity = EV − debt + cash. It assumes immediate perpetual growth and ignores a transition period and other claims. No issuer inputs or target prices are used.
SOURCES
01YOUR NOTES