Label the table before copying the number
A balance sheet reports a position at a date. An income statement and cash-flow statement report activity over a period. The AAOI June 2026 10-Q has three-month and six-month columns in the same statement; its balance sheet uses June 30 and the prior December 31. Units are thousands of US dollars. Reading 191,922 as millions, or copying a six-month cash number into a three-month comparison, creates an error before any valuation work begins. Record company, form, amendment status, period, currency, unit and GAAP status next to every extracted number.
For AAOI, second-quarter 2026 revenue is $191.922 million and gross profit is $53.207 million. Their ratio is 27.72%, rounded from the author's calculation. For fiscal 2025, the annual report gives revenue of $455.715 million and gross profit of $136.913 million, producing approximately 30.04%. These are different periods, not evidence of a sequential quarterly margin decline. The annual figure combines four quarters; compare the appropriate quarter or a consistent trailing period before interpreting a trend.
- 1Income statement: revenue
- 2cost of goods
- 3gross profit
- 4operating expenses
- 1Cash reconciliation: net income
- 2noncash adjustments
- 3working capital
- 4CFO
- 1Cash after investment: CFO
- 2equipment purchases
- 3financing needs
Why a growing optical manufacturer can consume cash
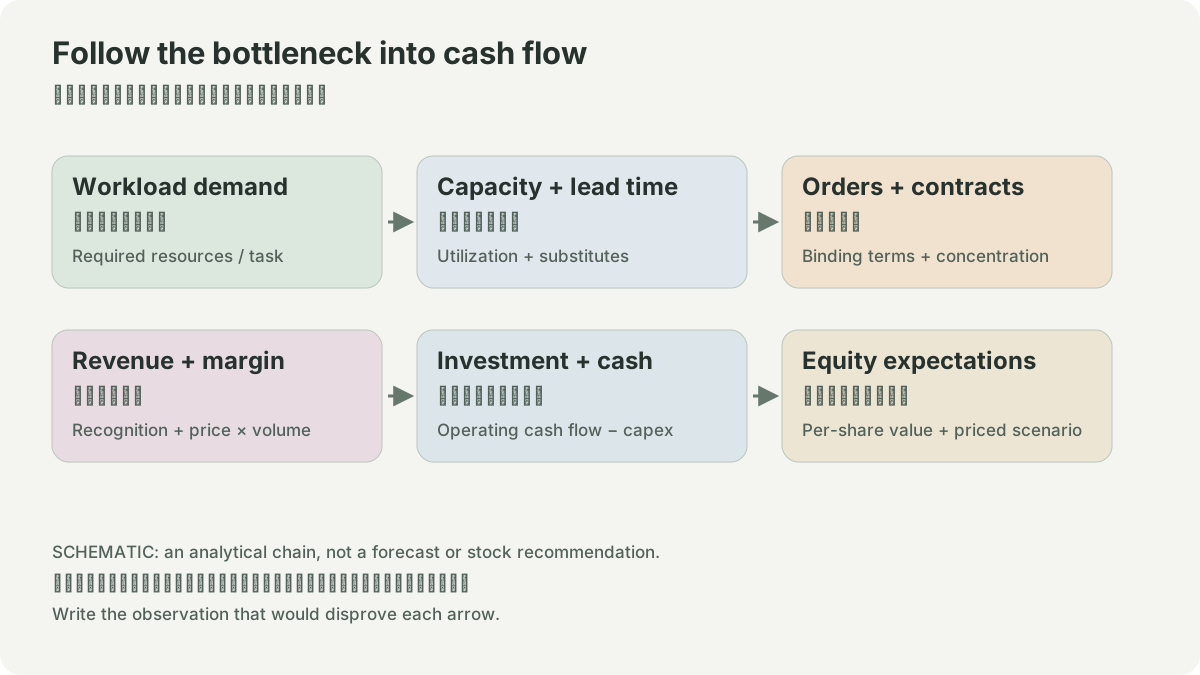
AAOI's fiscal 2025 report gives net cash used in operations of $174.428 million and equipment purchases of $179.148 million. Subtracting purchases from CFO gives minus $353.576 million. This is an explicitly defined CFO-minus-PP&E cash lens, not a GAAP line named free cash flow. It excludes other investing transactions and financing, and it does not say whether the investment will earn an adequate return. Negative cash after investment can finance a promising ramp or an unsuccessful one. Qualification, utilization, collections and future margins determine the distinction.
The June 2026 filing reports accounts receivable of $314.009 million and inventory of $278.791 million at the balance-sheet date, with operating cash use of $73.781 million in the first half. Those balances should prompt investigation of payment terms, revenue timing, inventory composition and production plans. Dividing closing receivables by a quarter's revenue and multiplying by 90 gives a rough diagnostic, not audited days-sales-outstanding: average balances, quarter length, customer mix and timing differ. Use averages when available and label every shortcut.
Product growth can hide different economics inside one company
Bloom's June 2026 statement, as presented in the linked 10-Q/A, reports quarterly revenue of $1,065.365 million and gross profit of $355.572 million. The resulting aggregate gross margin is approximately 33.38%. The product line contributes $935.413 million of revenue against $593.957 million cost, whereas installation has $50.978 million revenue against $52.829 million cost. Installation therefore has negative gross profit in this period. That arithmetic illustrates why a consolidated margin should not be assigned indiscriminately to every activity.
Compare product, installation, service and electricity separately. Growth in a high-margin mix may lift consolidated margin while an operational burden remains in installation or maintenance. Do not replace the period-specific mix with a forever assumption. Also distinguish total net income from income attributable to common shareholders: the latter removes noncontrolling interests and is the appropriate starting point for common-share EPS. An amendment is a separate filing event; use the corrected document and retain that status in the worksheet.
A repeatable extraction exercise
Create one worksheet per company, with columns for period, revenue, gross profit, operating income, CFO, PP&E purchases, cash, debt and diluted shares. Leave a missing number explicitly unverified rather than estimating it from another provider's ratio. Link each value to its statement and keep reported values apart from your formulas. Next write three explanations for any cash/profit gap: noncash expenses, working capital and reinvestment. Check the reconciliation rather than selecting the explanation that fits your investment thesis.
Finally run an original stress test: suppose collections are delayed by an extra 30 days on annual sales of 1,200 units. With evenly distributed sales and no other change, approximately 100 additional units become tied up in receivables. Profit can be unchanged while financing needs rise by 100. A real company requires actual contract terms and average balances. The example shows why the timing of cash deserves its own model.
VALUATION / HYPOTHETICAL INPUTS
How much does one assumption change value?
Toy model: current annual cash flow 500m, debt 1,000m, cash 200m and 100m diluted shares. EV = cash flow × (1 + g) / (r − g); equity = EV − debt + cash. It assumes immediate perpetual growth and ignores a transition period and other claims. No issuer inputs or target prices are used.
SOURCES
01YOUR NOTES