What was actually observed
The following market-data tool snapshot was retrieved on October 4, 2026 in Japan. It reports latest trades on October 2 in US Eastern daylight time, including extended hours. These are latest trade observations, not verified official regular-session closing prices. The Nasdaq page is a public listing/quote reference, not the provenance of every number in the tool feed. A later quote or a different provider can use a different session, adjustment or update time. This archive records the observation instead of presenting it as a live ticker.
| Symbol | Latest trade, USD | Trade time, UTC | Trade time, EDT |
|---|---|---|---|
| SNDK | 1,719.99 | 2026-10-03 00:15:00 | 2026-10-02 20:15:00 |
| BE | 289.15 | 2026-10-02 23:59:39 | 2026-10-02 19:59:39 |
| AAOI | 115.59 | 2026-10-03 00:15:00 | 2026-10-02 20:15:00 |
| MU | 1,074.89 | 2026-10-03 00:15:00 | 2026-10-02 20:15:00 |
The raw public observation is saved as the dated snapshot. It contains the session caveat and tool provenance. No continuous historical series was obtained for this chapter. Consequently, the exercises below are clearly hypothetical; they are not reconstructed charts of these securities.
Price, capitalization and enterprise value answer different questions
A share price depends on the number of units into which ownership is divided. A stock split can change price without changing the owner's economic fraction. Compare businesses using consistent capitalization and financial denominators, not the dollar price of one share. Market capitalization is price times the relevant shares outstanding at the quote date. Enterprise value adds claims such as debt and subtracts eligible cash, with other adjustments depending on the definition. Weighted-average diluted shares in a fiscal EPS calculation need not equal the current shares used in a market-cap feed.
Sandisk's annual GAAP EPS and a quote provider's earnings figure can disagree because the fiscal period, trailing window or adjustments differ. Do not force them to match by choosing the convenient value. A negative earnings denominator, as can occur for an optical manufacturer, makes a negative P/E unhelpful for a conventional “cheapness” ranking. Revenue multiples also leave margins and funding requirements unresolved. Always record the denominator date and definition.
Calculate return and drawdown in an original exercise
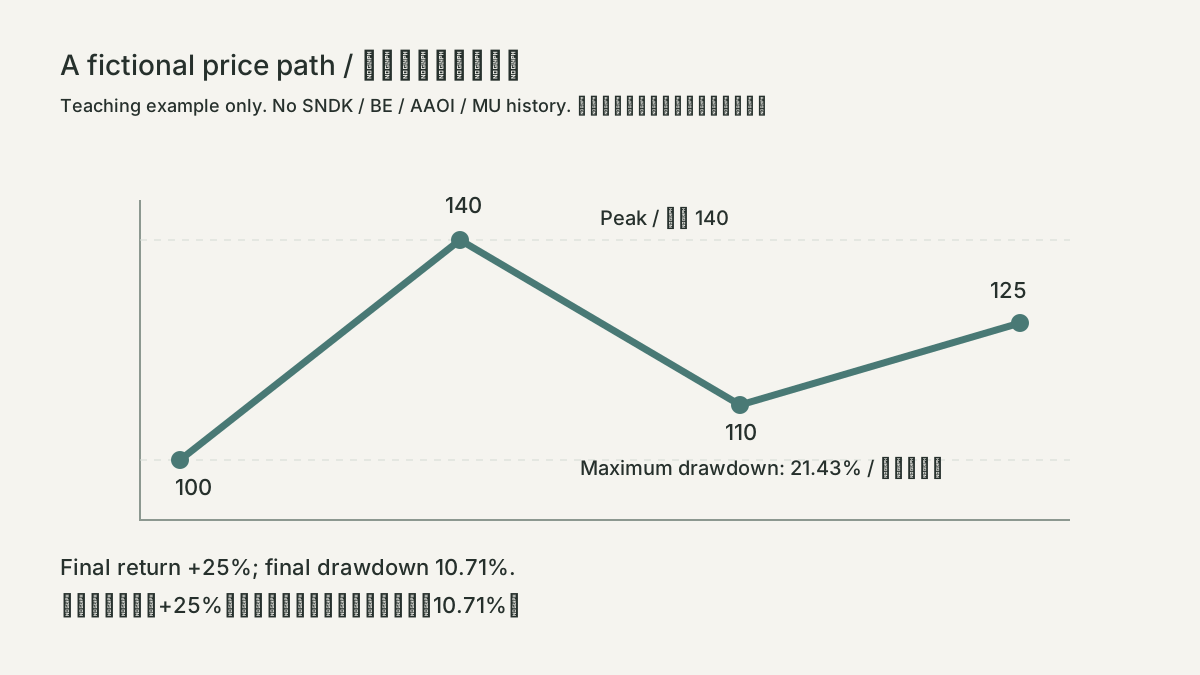
Use a fictional price path of 100, 140, 110 and 125. The first gain is 40%; the subsequent fall is approximately 21.43%. The final return relative to the starting point is 25%. At the final observation, drawdown from the running peak is 1 − 125/140, approximately 10.71%. Maximum drawdown over the path is approximately 21.43%. These are different questions: the return compares two chosen dates, whereas drawdown compares a price with a previously reached peak.
- 1Choose session and adjustment
- 2align observation dates
- 3calculate return
- 1Track running peak
- 2compare current value with peak
- 3calculate drawdown
- 1Add dividends and corporate actions
- 2calculate a consistent total-return series
A 50% loss requires a 100% gain to recover. Starting at 100, falling to 50 and rising 50% produces 75, not 100. Arithmetic returns cannot simply be added across periods; growth factors multiply. The example explains why a volatile supplier can have a compelling operating story while a buyer at an expensive price experiences a large loss. It does not quantify the historical risk of SNDK, BE, AAOI or MU.
An honest price-history workflow
To create an actual chart later, obtain a licensed daily series, record provider and access time, select adjusted or unadjusted prices intentionally, and retain split/dividend treatment. Fix the start and end dates before comparing companies. Align trading days and currencies, disclose missing observations and fail explicitly when the data is absent. Do not fill missing prices with a made-up trend or confuse a flat forward-filled line with observed trading.
Compare a price chart with operating evidence on separate time axes. A quarterly result describes a completed fiscal period; a price may anticipate several future periods. Mark filing dates, announcements, capital raises and qualification events, but do not assume a nearby price move was caused by one event without further evidence. This chapter's dated snapshot is a reproducible observation boundary. A real historical performance claim requires the historical dataset and its adjustment contract.
VALUATION / HYPOTHETICAL INPUTS
How much does one assumption change value?
Toy model: current annual cash flow 500m, debt 1,000m, cash 200m and 100m diluted shares. EV = cash flow × (1 + g) / (r − g); equity = EV − debt + cash. It assumes immediate perpetual growth and ignores a transition period and other claims. No issuer inputs or target prices are used.
SOURCES
01YOUR NOTES