Date the observation before telling a macro story
The research window for this chapter is September 4–October 4, 2026, Asia/Tokyo. On September 16, the Federal Reserve raised its target range by 0.25 percentage point to 3.75–4.00%. This is the policy decision in the dated statement, not an inference from a remembered easing cycle. The September 2024 statement records a 0.50-point reduction to 4.75–5.00%, illustrating why an old direction of travel cannot substitute for the current decision.
The September 16 economic projections give median 2026 real GDP growth of 2.3%, PCE inflation of 3.7% and a year-end federal-funds-rate midpoint projection of 4.1%. These are participants' projections under their own policy assumptions. The 4.1% projection is not the current target range, a commitment to future policy or a market-implied probability. Different data types belong in different rows of the notebook.
CPI and PCE are observations, not the same index
The BLS release published September 11 reports August CPI increasing 0.4% month on month on a seasonally adjusted basis and 3.4% year on year on an unadjusted basis. The BEA September 30 release reports August PCE prices increasing 0.3% month on month and 3.4% year on year, with core PCE at 3.0% year on year. CPI and PCE have different coverage, weights and methods; equal headline annual rates do not make them interchangeable. Keep the data month, release date, annual/monthly comparison and adjustment basis explicit.
September CPI was not yet released at this October 4 observation. The BLS release schedules it for October 14. Likewise the BEA schedules September personal income and outlays for October 29. A current-month calendar entry is a future event, not a current observation. Revisions can change old estimates, so preserve the vintage when comparing archived commentary with a later table.
- 1Published inflation data
- 2policy and funding conditions
- 3discount-rate assumptions
- 1Customer financing and demand
- 2capex plans
- 3actual equipment orders
- 4supplier cash
- 1Energy and materials costs
- 2product economics
- 3margins and reinvestment
Why rates matter more when cash arrives later
Discounting translates future cash into present monetary units. In an original example, 100 received five years from now is worth approximately 68.06 at an 8% annual discount rate and 62.09 at 10%, using 100/(1+r)^5. The higher rate lowers the value by about 8.8%, with no change to the future cash amount. This is arithmetic, not a forecast of a stock response. A company that needs many years of reinvestment before cash generation can be more sensitive to financing and discount assumptions than one that already distributes cash.
Do not use the Federal Reserve target as an equity discount rate. A company's financing cost and required equity return also depend on credit risk, term, currency, leverage and uncertainty. Nominal cash flows need a nominal discount rate on a consistent basis. Applying a real rate to nominal revenues mixes inflation assumptions. A perpetuity calculation is especially sensitive when the discount rate approaches assumed growth; the simple model is undefined when r is not greater than g.
AI capex transmits through contracts and delivery
An announced capital-spending budget is neither a supplier purchase order nor recognized supplier revenue. A project must secure land, power, network capacity and equipment, then meet delivery and acceptance conditions. Faster demand for compute can increase orders in one part of the chain while another part cannot install them. Rising energy or construction costs can reduce project returns even if software demand is strong. Read the customer plan, the supplier contract and the supplier's cash conversion separately.
For an original scenario worksheet, hold equipment demand fixed and raise the funding rate first. Then hold rates fixed and delay energization by six months. Finally raise fuel costs while keeping output fixed. Track which company bears each change: developer, power-system supplier, utility, component manufacturer or customer. Avoid assuming every AI-related issuer has the same macro exposure. A NAND cycle, a gas-backed power system and an optical qualification ramp have different timing and cost structures.
A bounded update routine
At each scheduled review, save the actual new release, its publication time and the period measured. Update the facts table before changing the interpretation. Compare the new observation with a previously written condition, such as whether collections, margins or project acceptance weakened. Keep forecasts in a separate column and retain old dated notes. Macro data can explain a plausible transmission mechanism; establishing that it caused a particular stock move requires additional evidence.
VALUATION / HYPOTHETICAL INPUTS
How much does one assumption change value?
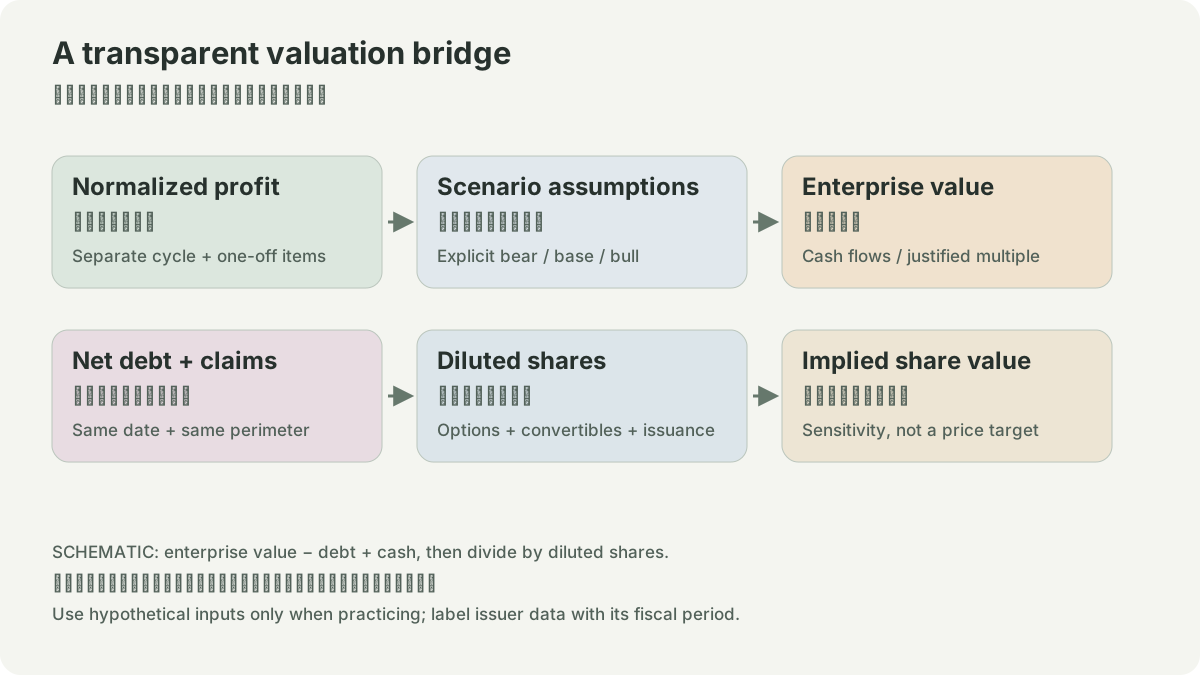
Toy model: current annual cash flow 500m, debt 1,000m, cash 200m and 100m diluted shares. EV = cash flow × (1 + g) / (r − g); equity = EV − debt + cash. It assumes immediate perpetual growth and ignores a transition period and other claims. No issuer inputs or target prices are used.
SOURCES
01YOUR NOTES