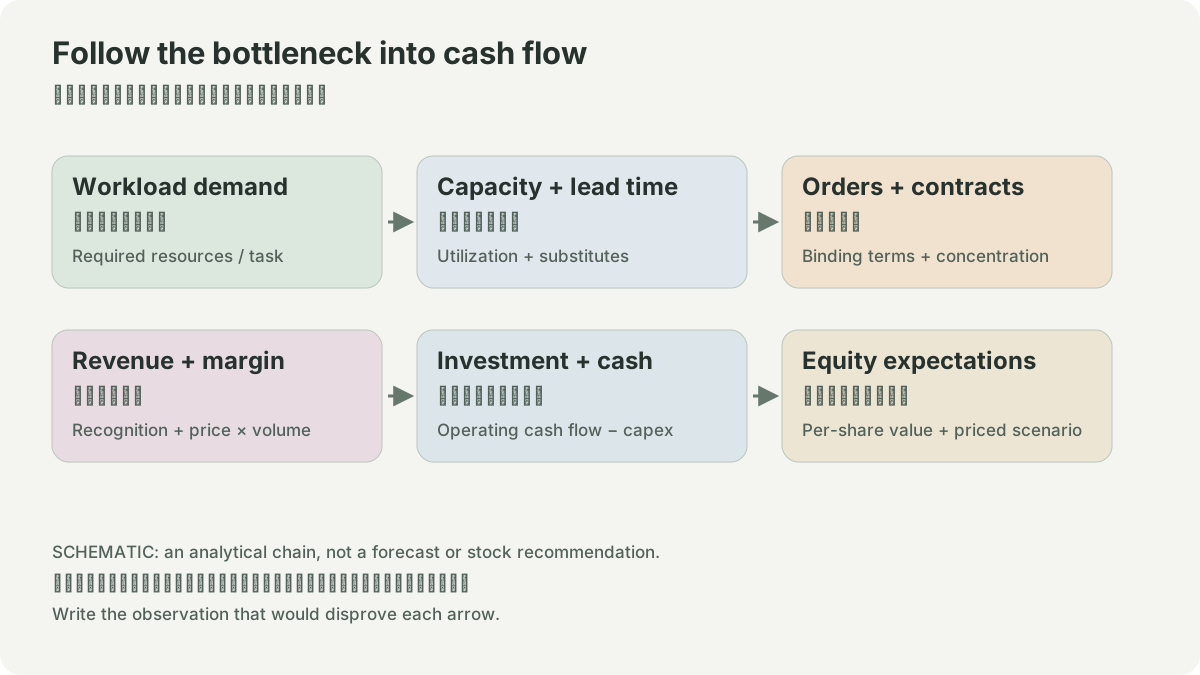
Revenue is volume times realized value, plus mix
NAND demand narratives often collapse three variables: exabytes sold, realized revenue per gigabyte, and product/customer mix. SanDisk’s FY2026 10-K makes the separation visible. It reports total products sold up mid-teens percent on an exabyte basis while revenue rose 175% to $20.248 billion. That combination means a price/mix explanation is material; volume alone cannot explain the revenue change.
- 1exabytes shipped × realized revenue/GB + product/customer mix
- 2revenue
- 1inventory and channel timing
- 2reported period
- 3cash collection
For Datacenter, the 10-K reports revenue of $5.153 billion, up 437%; products sold up almost 120% on an exabyte basis; and revenue per gigabyte up almost 150%. Edge revenue was $12.160 billion, up 195%, with exabytes up high single digits and revenue per gigabyte up almost 180%. Consumer revenue was $2.935 billion, up 29%; exabytes declined mid-teens while revenue per gigabyte rose low fifties. These are management’s disclosed directional measures, not a third-party price index.
Why realized price is not a spot price
Revenue per gigabyte embeds product mix, negotiated contract timing, capacity points, controller/firmware value, channel incentives, returns and price protection. The filing says sales incentives and marketing programs reduced gross revenue by 11% in FY2026, compared with 19% in FY2025 and FY2024. That is an accounting and channel fact that must be considered before equating a quoted NAND price with reported revenue.
A toy calculation: if exabytes rise 10% and revenue per gigabyte rises 20%, unchanged mix would produce roughly 32% revenue growth (1.10 × 1.20 − 1). If revenue rises 40%, mix may add value; if it rises 20%, mix, discounts, timing, or a different definition may offset. This is not a forecast and cannot identify a supplier’s pricing without its filings.
Demand also has a calendar. The 10-K says SanDisk historically has higher demand in the first and second fiscal quarters, while cyclicality and macro conditions can alter seasonality. Inventory can pull revenue forward or defer it. The FY2026 cash-flow statement records a $619 million inventory increase and $3.640 billion accounts-receivable increase; neither proves demand is weak, but both make a simplistic “revenue equals cash demand” claim incomplete.
Exercise: test a pricing statement
For any claim that flash demand improved, state the period, end market, volume measure, revenue-per-gigabyte measure, revenue, and inventory change. Then write a competing explanation: mix, channel restocking, price protection, or timing. An invalidation condition is a later filing in which volume rises but realized revenue/GB falls, or the segment definition changes. SanDisk’s FY2026 10-K supplies the dated example; it does not establish a future price trajectory.
ROOFLINE / HYPOTHETICAL INPUTS
Does memory feed the compute?
Upper bound = min(compute ceiling, bandwidth × arithmetic intensity). Decimal TB = 10¹² bytes. Cache effects, access patterns, communication and actual utilization are omitted; this is not a device benchmark. More capacity does not necessarily increase bandwidth.
SOURCES
01YOUR NOTES