ticker でなく境界から始める
SanDisk demand and pricing は市場物語より先に systems の問いである。memory capacity、bandwidth、latency、packaging yield、inventory、capital intensity は AI system の異なる部分を制約する。vendor announcement は product roadmap を説明できても、shipment volume、実現 margin、競争 share、投資可能な結果を独立に証明しない。技術 mechanism、会社の claim、条件付き thesis を同じ notebook で分ける。
- 1workload と data movement
- 2memory requirement
- 3package と供給制約
- 1会社開示
- 2会計 line item
- 3scenario assumption
- 4invalidation test
mechanism と測定
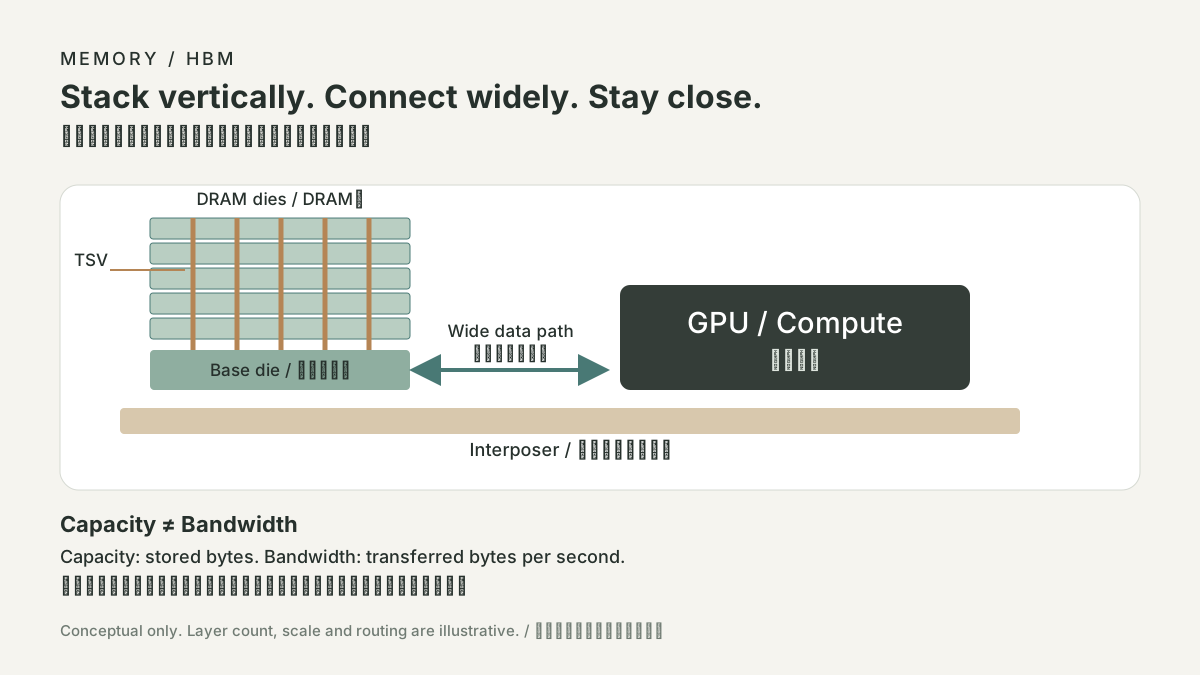
境界のある workload を定義する。batch、context、model、accelerator 数、storage path、許容する tail latency を書き、一度に一つの量だけを測る。HBM は accelerator 近くの bandwidth を変え得るが、compute、networking、software、power の制約を自動で直さない。NAND/SSD は persistence と dataset movement を変える。stacked memory では TSV と package assembly が yield と qualification の依存を足す。財務では revenue、gross margin、operating cash flow、capital expenditure は異なる量で、代用してはいけない。
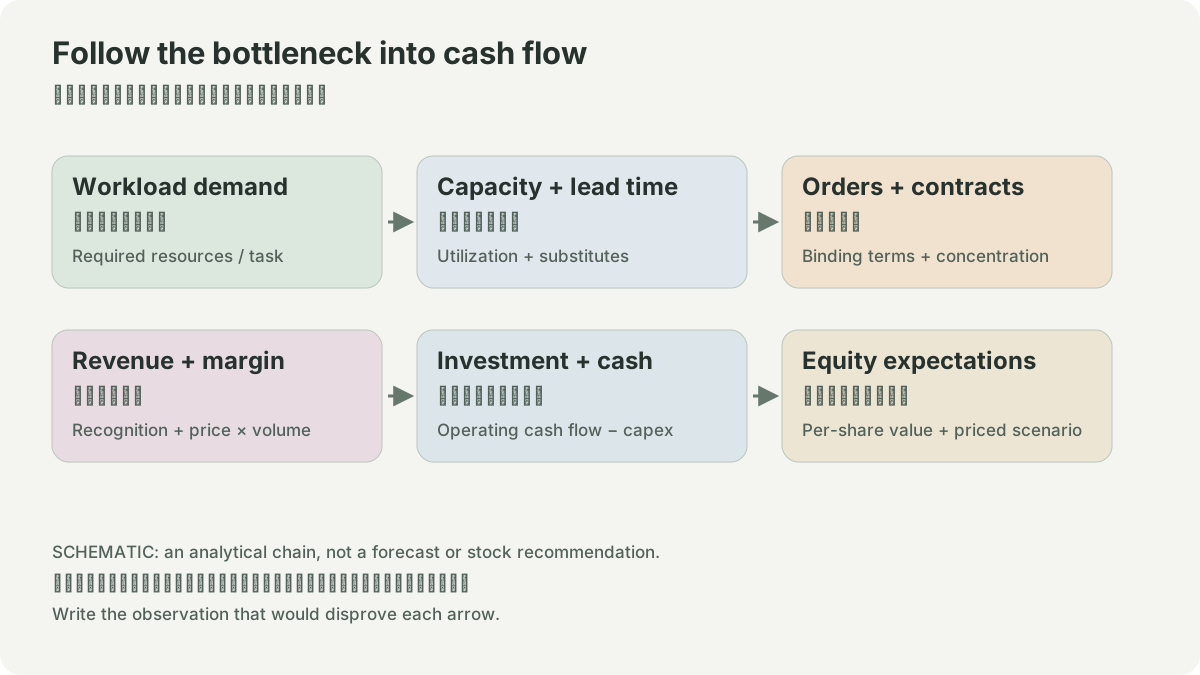
演習として三つの scenario を作る。base case では unit demand と price assumption を明示する。upside case では qualification、yield improvement、持続した utilization のように必要な運用証拠を挙げる。downside case では ASP、bit shipments、yield、capex efficiency の一つだけを先に下げる。revenue と cash need の変化を計算し、その scenario を無効にする証拠を列挙する。これは scenario math であり株価目標ではない。
証拠の限界と次の作業
Micron の quarterly material と SK hynix/Samsung のページは issuer disclosure である。各社が各日付で述べたことを支える。現在の Samsung newsroom index は未日付 index なので、日付付き release として扱わない。HBM4 ページは product/roadmap の説明を支えるが、vendor の独立比較ではない。利用前に正確な filing または earnings release を取り、可能なら non-GAAP を filing と reconcile し、access date を残す。本稿は prices、market shares、future earnings を主張しない。
exabyteとdollarを分ける
FY2026 10-Kではtotal products soldはexabyteベースでmid-teens増、revenueは175%増だった。数量だけでは売上変化を説明できず、realized revenue per gigabyteとproduct/customer mixが必要になる。Datacenterはrevenue 51.53億ドル、exabyte almost 120%増、revenue/GB almost 150%増。Edgeは121.60億ドル、exabyte high-single-digit増、revenue/GB almost 180%増。Consumerは29.35億ドル、exabyte mid-teens減でもrevenue/GB low-fifties増だった。これは会社開示の方向性で、独立price indexではない。
- 1exabyte shipped × realized revenue/GB + mix
- 2reported revenue
- 1channel incentive/price protection/inventory
- 2timingとcash
revenue/GBにはcapacity point、controller/firmware、contract timing、return、price protectionが混ざる。10-Kはsales incentive/marketing programがgross revenueの11%だったとする。spot NAND priceをそのままreported revenueへ入れない。玩具計算でvolume 10%増、realized price 20%増なら、mix一定の売上増は約32%(1.10×1.20−1)。実績が違えばmix、discount、timing、定義を点検する。
またFY2026にはinventoryが6.19億ドル、receivableが36.40億ドル増えた。これは需要悲観の証明ではないが、revenueとcash demandを同一視できない理由になる。主張にはperiod、end market、volume、revenue/GB、inventoryを置き、後続filingでvolumeは増えてprice/GBが下がる、またはsegment定義が変わることを反証条件にする。
ROOFLINE / 仮想的な入力
メモリは計算装置へ十分にデータを送れるか。
上限 = min(計算の上限, 帯域 × 演算密度)。TBは10¹² byte。キャッシュ、アクセスの形、通信、実際の稼働率を省いた上限で、製品の測定ではありません。容量を増やしても帯域が増えるとは限りません。
出典
01自分のノート