ticker でなく境界から始める
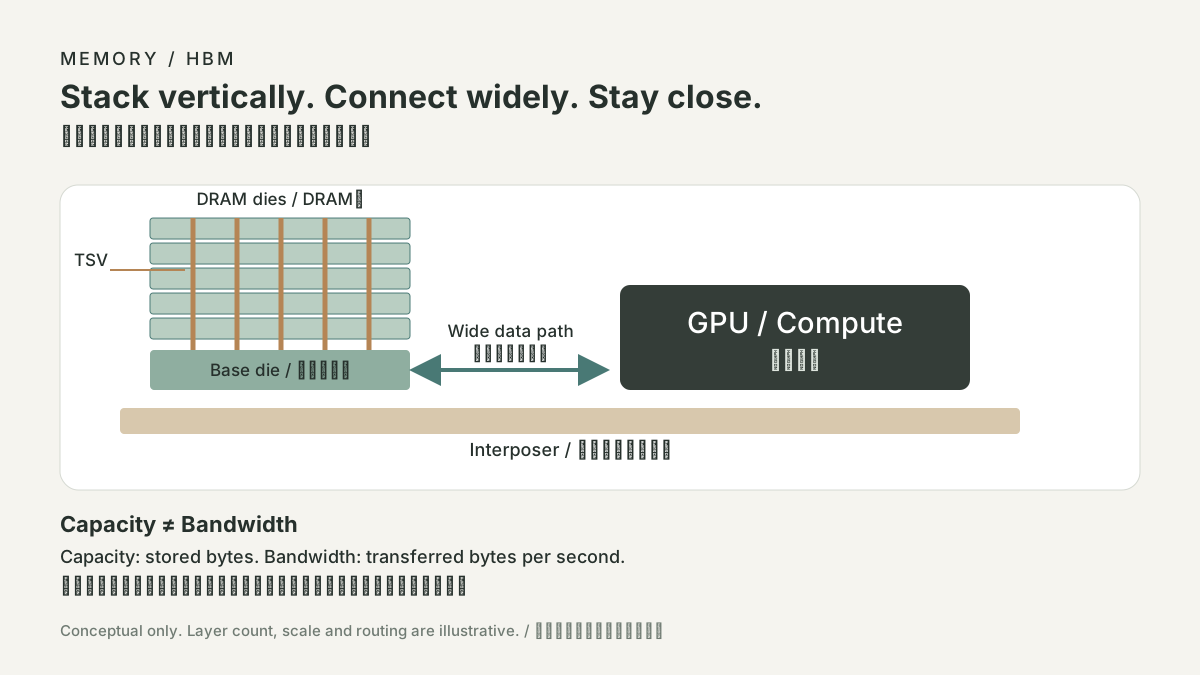
Reading SanDisk financial statements は市場物語より先に systems の問いである。memory capacity、bandwidth、latency、packaging yield、inventory、capital intensity は AI system の異なる部分を制約する。vendor announcement は product roadmap を説明できても、shipment volume、実現 margin、競争 share、投資可能な結果を独立に証明しない。技術 mechanism、会社の claim、条件付き thesis を同じ notebook で分ける。
- 1workload と data movement
- 2memory requirement
- 3package と供給制約
- 1会社開示
- 2会計 line item
- 3scenario assumption
- 4invalidation test
mechanism と測定
境界のある workload を定義する。batch、context、model、accelerator 数、storage path、許容する tail latency を書き、一度に一つの量だけを測る。HBM は accelerator 近くの bandwidth を変え得るが、compute、networking、software、power の制約を自動で直さない。NAND/SSD は persistence と dataset movement を変える。stacked memory では TSV と package assembly が yield と qualification の依存を足す。財務では revenue、gross margin、operating cash flow、capital expenditure は異なる量で、代用してはいけない。
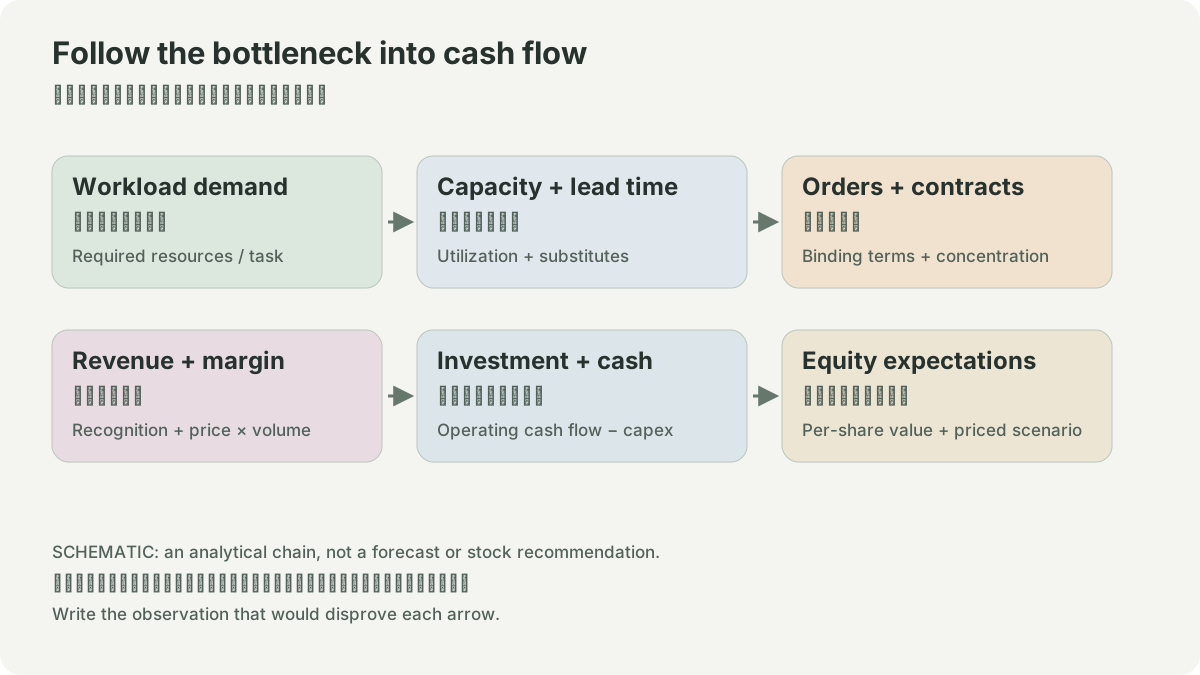
演習として三つの scenario を作る。base case では unit demand と price assumption を明示する。upside case では qualification、yield improvement、持続した utilization のように必要な運用証拠を挙げる。downside case では ASP、bit shipments、yield、capex efficiency の一つだけを先に下げる。revenue と cash need の変化を計算し、その scenario を無効にする証拠を列挙する。これは scenario math であり株価目標ではない。
証拠の限界と次の作業
Micron の quarterly material と SK hynix/Samsung のページは issuer disclosure である。各社が各日付で述べたことを支える。現在の Samsung newsroom index は未日付 index なので、日付付き release として扱わない。HBM4 ページは product/roadmap の説明を支えるが、vendor の独立比較ではない。利用前に正確な filing または earnings release を取り、可能なら non-GAAP を filing と reconcile し、access date を残す。本稿は prices、market shares、future earnings を主張しない。
GAAPの五行を同じ期間で読む
FY2026(2026年7月3日終了)の10-KはGAAP revenue 202.48億ドル、gross profit 144.72億ドル、gross margin 71.5%、operating income 123.89億ドル、net income 114.33億ドルを報告する。cash from operationsは116.71億ドル、PP&E purchasesは1.77億ドルである。profit、CFO、PP&Eを同じ「cash generation」や「capex」と呼ばない。FY2025はrevenue 73.55億ドル、gross margin 30.1%、net loss 16.41億ドルで、同じGAAP basisだが分離前配賦costの注記も読む。
- 1revenue - cost of revenue = gross profit
- 1net income + noncash ± working capital = CFO
- 1CFO - PP&E purchases = 定義を明示したcash指標
FY2026のcash-flow reconciliationではaccounts receivableが36.40億ドル、inventoryが6.19億ドル増え、operating cashを使った。一方refund liability 13.74億ドル、contract liabilities 12.17億ドル、income taxes payable 13.70億ドルの変化もCFOへ影響する。これらを翌年も続くmarginと扱わない。marketable equity securitiesの9.70億ドル購入やFlash VenturesへのnotesはPP&E purchasesとは別の投資cash flowである。
基本/希薄化weighted average sharesは147m/155m、GAAP EPSは77.78/73.76ドルだった。平均株数、期末発行済株数、任意時点の株価を混ぜない。演習として五行を表に転記し、gross marginを144.72÷202.48で再計算し、cash conversionの主張をCFO、receivable、inventory、PP&Eのどれが反証するかを書く。
ROOFLINE / 仮想的な入力
メモリは計算装置へ十分にデータを送れるか。
上限 = min(計算の上限, 帯域 × 演算密度)。TBは10¹² byte。キャッシュ、アクセスの形、通信、実際の稼働率を省いた上限で、製品の測定ではありません。容量を増やしても帯域が増えるとは限りません。
出典
01自分のノート