Scroll horizontally to read the diagram.
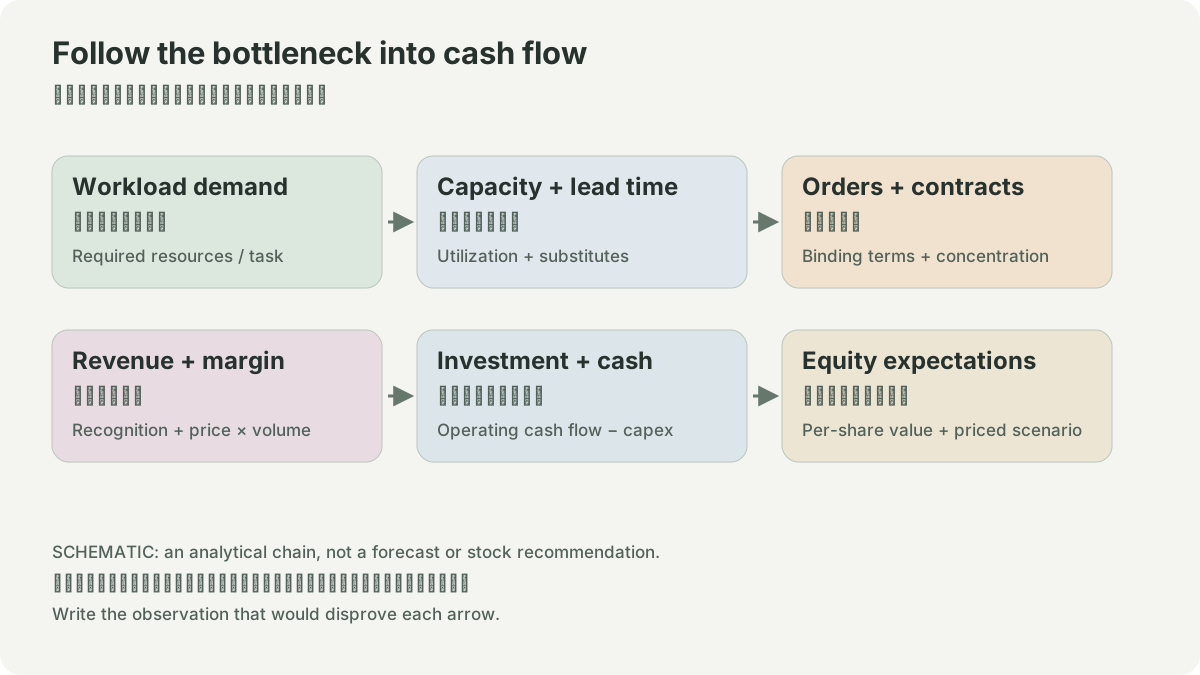
Diagram text description
The six boxes form two rows of three, with two right-facing arrows within each row. Across the top: Workload demand, labelled “training and inference demand” and “Required resources / task,” points to Capacity + lead time, labelled “supply capacity and construction schedule” and “Utilization + substitutes,” which points to Orders + contracts, labelled “orders and contracts” and “Binding terms + concentration.” Across the bottom: Revenue + margin, labelled “revenue and gross profit” and “Recognition + price × volume,” points to Investment + cash, labelled “capital spending and working capital” and “Operating cash flow − capex,” which points to Equity expectations, labelled “debt, dilution and share price” and “Per-share value + priced scenario.” No arrow connects the two rows.
The subtitle links technical scarcity to business value per share. The heading asks the reader to follow a bottleneck into cash flow. The notes call this an analytical schematic, not a forecast or stock recommendation. They say investment outcomes can change with increased supply, competition, investment burdens and a high share price even when a component is important. The final instruction is to write the observation that would disprove each arrow. No numeric forecast is given.
Begin with the document, period and unit
This dated exercise extends the cash-flow and capex chapter. Micron Technology, Inc. is CIK 0000723125. Its September 30 Form 8-K supplies the reporting context: fiscal 2026 ended September 3, and Item 2.02 and Exhibit 99.1 are furnished, not deemed filed under Section 18. The attached statements are unaudited; this note does not substitute them for an audited annual report or assert that no later amendment can exist. The reviewed SEC recent inventory showed no later relevant amendment as of October 4, 07:44 JST; that is a time-bounded check.
The results exhibit reports these annual amounts in USD millions:
| Statement location | FY2026 amount |
|---|---|
| GAAP operating cash flow | 89,675 |
| Cash spent on property, plant and equipment | 30,712 |
| Government incentive proceeds | 3,316 |
| PP&E sale proceeds, reconciliation table | 29 |
| Customer contract liability deposits, financing cash flow | 12,747 |
| Noncurrent customer contract liabilities, closing balance | 12,895 |
The final row is a balance at a date; the preceding rows are annual flows. Do not subtract them to invent a deposit repayment, recognized revenue or customer identity.
Rebuild the metric before using its headline
Two original calculations using the reported inputs make the distinction visible:
CFO minus gross PP&E spending = 89,675 − 30,712 = 58,963
Net investment bridge = 30,712 − 3,316 − 29 = 27,367
CFO minus that net investment = 89,675 − 27,367 = 62,308
The last value matches the issuer's non-GAAP adjusted free-cash-flow reconciliation. The first is a separately labelled convention. A reader must choose a definition before comparing companies; changing it midway can make an investment program appear cheaper without any change in the factory. Micron's September 25, 2024 results already presented operating cash, net capex and adjusted free cash flow separately. This is a continuing accounting discipline, not a new definition created by AI demand.
- 1Same fiscal period and unit
- 2operating cash flow
- 3choose gross or reconciled net investment
- 1Customer deposit receipt
- 2financing classification
- 3separate contract obligation review
- 1Cash available
- 2investment stage and qualification
- 3future capacity remains conditional
The SEC guide distinguishes period cash flows from the balance sheet's point-in-time position and separates operating, investing and financing activities. That structure is why cash received is not interchangeable with revenue earned. The exhibit classifies the deposit receipt within financing; its detailed contract terms and recognition schedule are not established by that line. Calling it recurring operating cash or adding it to adjusted free cash flow would change the displayed definition.
A funding bridge is not a capacity forecast
Consider an original, fictional manufacturer, unrelated to Micron's reported results. It receives a 120-unit customer deposit and spends 100 units on tools. Its bank balance can rise by 20 before the tools make any qualified product. A construction delay can leave the cash receipt intact while postponing output; a qualification failure can prevent the planned product mix. The receipt therefore answers a funding question. It does not answer the questions of delivery, yield, margin or recurring cash generation.
Build three boxes on paper: funding, obligations and productive capacity. Put the receipt in funding. Put the still-unread contract's delivery, refund and pricing conditions in obligations, with explicit unknowns. Put installation, yield and qualification in capacity. Draw an arrow only when a source supports it. This avoids inferring HBM supply from a financing line or treating advance funding as free equity value. Continue with HBM's packaging and bandwidth mechanism when studying the physical constraints.
An offline reconciliation exercise
The r/MU_Stock thread posted September 30 UTC contains questions about the price reaction despite strong earnings headlines. That is a community question worth examining through the cash-to-value chain. The thread's consensus figures and trading remarks were not verified here; its reactions supply no observed return or contract evidence.
No investment model, market-price history or manufacturing test was run here. For a local worksheet, copy the six inputs above with source, section, period, currency and unit. Recompute both cash conventions and flag any nonzero difference against the issuer's reconciliation. Keep the deposit receipt outside both formulas. Do not fill a missing contract term with a plausible default.
Then create an entirely hypothetical sensitivity: reduce operating cash by 10,000 and hold gross investment constant. Compare the resulting cash under both explicit definitions. The purpose is to see how much an operating assumption changes funding headroom, not to predict Micron's next quarter. Add a separate field for customer deposits that never flows into recurring CFO automatically.
Diagnose failures in order: wrong fiscal column, billions mixed with millions, spending sign reversed, incentive proceeds omitted, or a closing liability confused with a cash receipt. Finally list the evidence still needed for a business-value conclusion: contract terms, conversion of investment into qualified output, sustainable cash generation, debt and dilution, and a dated market valuation. No share-price target follows from this exercise.
ROOFLINE / HYPOTHETICAL INPUTS
Does memory feed the compute?
Upper bound = min(compute ceiling, bandwidth × arithmetic intensity). Decimal TB = 10¹² bytes. Cache effects, access patterns, communication and actual utilization are omitted; this is not a device benchmark. More capacity does not necessarily increase bandwidth.
Sources
Publication dates belong to the source; access dates record when it was checked. Community observations are separate from official statements.
01